Vision-language models (VLMs) are increasingly used to interpret charts and generate natural-language explanations for socially consequential data. However, they may produce different narratives for the same chart when only the referenced social group changes, reinforcing stereotypes and misleading decisions. Despite these risks, no benchmark exists for systematically evaluating bias in chart interpretation across social dimensions. We introduce ChartBias, the first benchmark for auditing bias in VLM-based chart interpretation. ChartBias contains 820 manually curated real-world charts spanning six attributes: race, income, age, religion, immigration status, and gender, yielding 4,319 valid chart, attribute instances and 8,638 paired generations where the chart is fixed and only the group term is swapped. Across 12 proprietary and open-source VLMs, totaling 155,484 model responses, we find three widespread failure modes: narrative shift (same chart, different narratives), group hallucination (assigning a chart to a group without evidence), and preference polarity (favourable trends often linked to one group). We further propose a multi-agent mitigation framework that serves as a strong baseline by separating chart-grounded evidence extraction from group-conditioned generation and using a counterfactual judge to verify that group-driven differences are supported by the chart. The framework substantially reduces narrative shift while preserving chart-grounded reasoning. Our findings show that evaluating chart understanding requires measuring not only accuracy, but also fairness and consistency across social groups. We release ChartBias at https://github.com/vis-nlp/ChartBiasBench.

This publication proposes a definition and a classification of agile software development approaches and analyses ten software development methods that can be characterized as being "agile" against the defined criterion.
P. Abrahamsson, O. Salo, Jussi Ronkainen et al.· arXiv.org· 727 citations· ⚡54
Consequences of happiness and unhappiness that are beneficial and detrimental for developers' mental well-being, the software development process, and the produced artifacts are found.
D. Graziotin, Fabian Fagerholm, Xiaofeng Wang et al.· Journal of Systems and Softw...· 236 citations· ⚡13
The Mobile-D approach is briefly outlined here and the experiences gained from four case studies are discussed, which helped develop an agile development approach for mobile application development.
P. Abrahamsson, Antti Hanhineva, H. Hulkko et al.· Conference on Object-Oriente...· 225 citations· ⚡18
A study with 42 participants investigates the relationship between the affective states, creativity, and analytical problem-solving skills of software developers and offers support for the claim that happy developers are indeed better problem solvers in terms of their analytical abilities.
D. Graziotin, Xiaofeng Wang, P. Abrahamsson· PeerJ· 216 citations· ⚡13
GAOKAO-Bench is introduced, an intuitive benchmark that employs questions from the Chinese GAOKAO examination as test samples, including both subjective and objective questions that contribute a robust evaluation benchmark for future large language models and offers valuable insights into the advantages and limitations...
Xiaotian Zhang, Chun-yan Li, Yi Zong et al.· arXiv.org· 216 citations· ⚡17
This state-of-practice investigation was performed using a literature review followed by a multiple-case study approach and presents how inconsistency between managerial strategies and execution can lead to failure by means of a behavioral framework.
Carmine Giardino, Xiaofeng Wang, P. Abrahamsson· International Conference on...· 175 citations· ⚡19
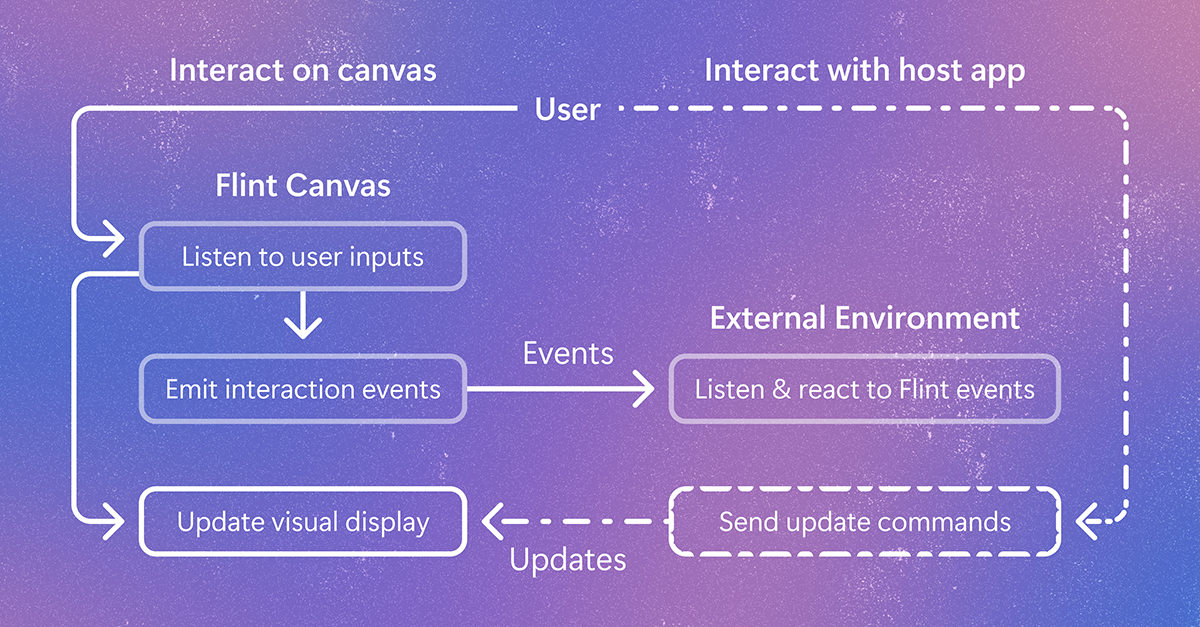
Flint-interactive gives AI agents a language for creating interactive visualizations. Click a chart, filter data, highlight related content, and explore beyond the view the author originally chose. The post Flint-interactive: A language for creating interactive data visualizations appeared first on Microsoft Research.